Count the structures under cover in your territory, once a year.
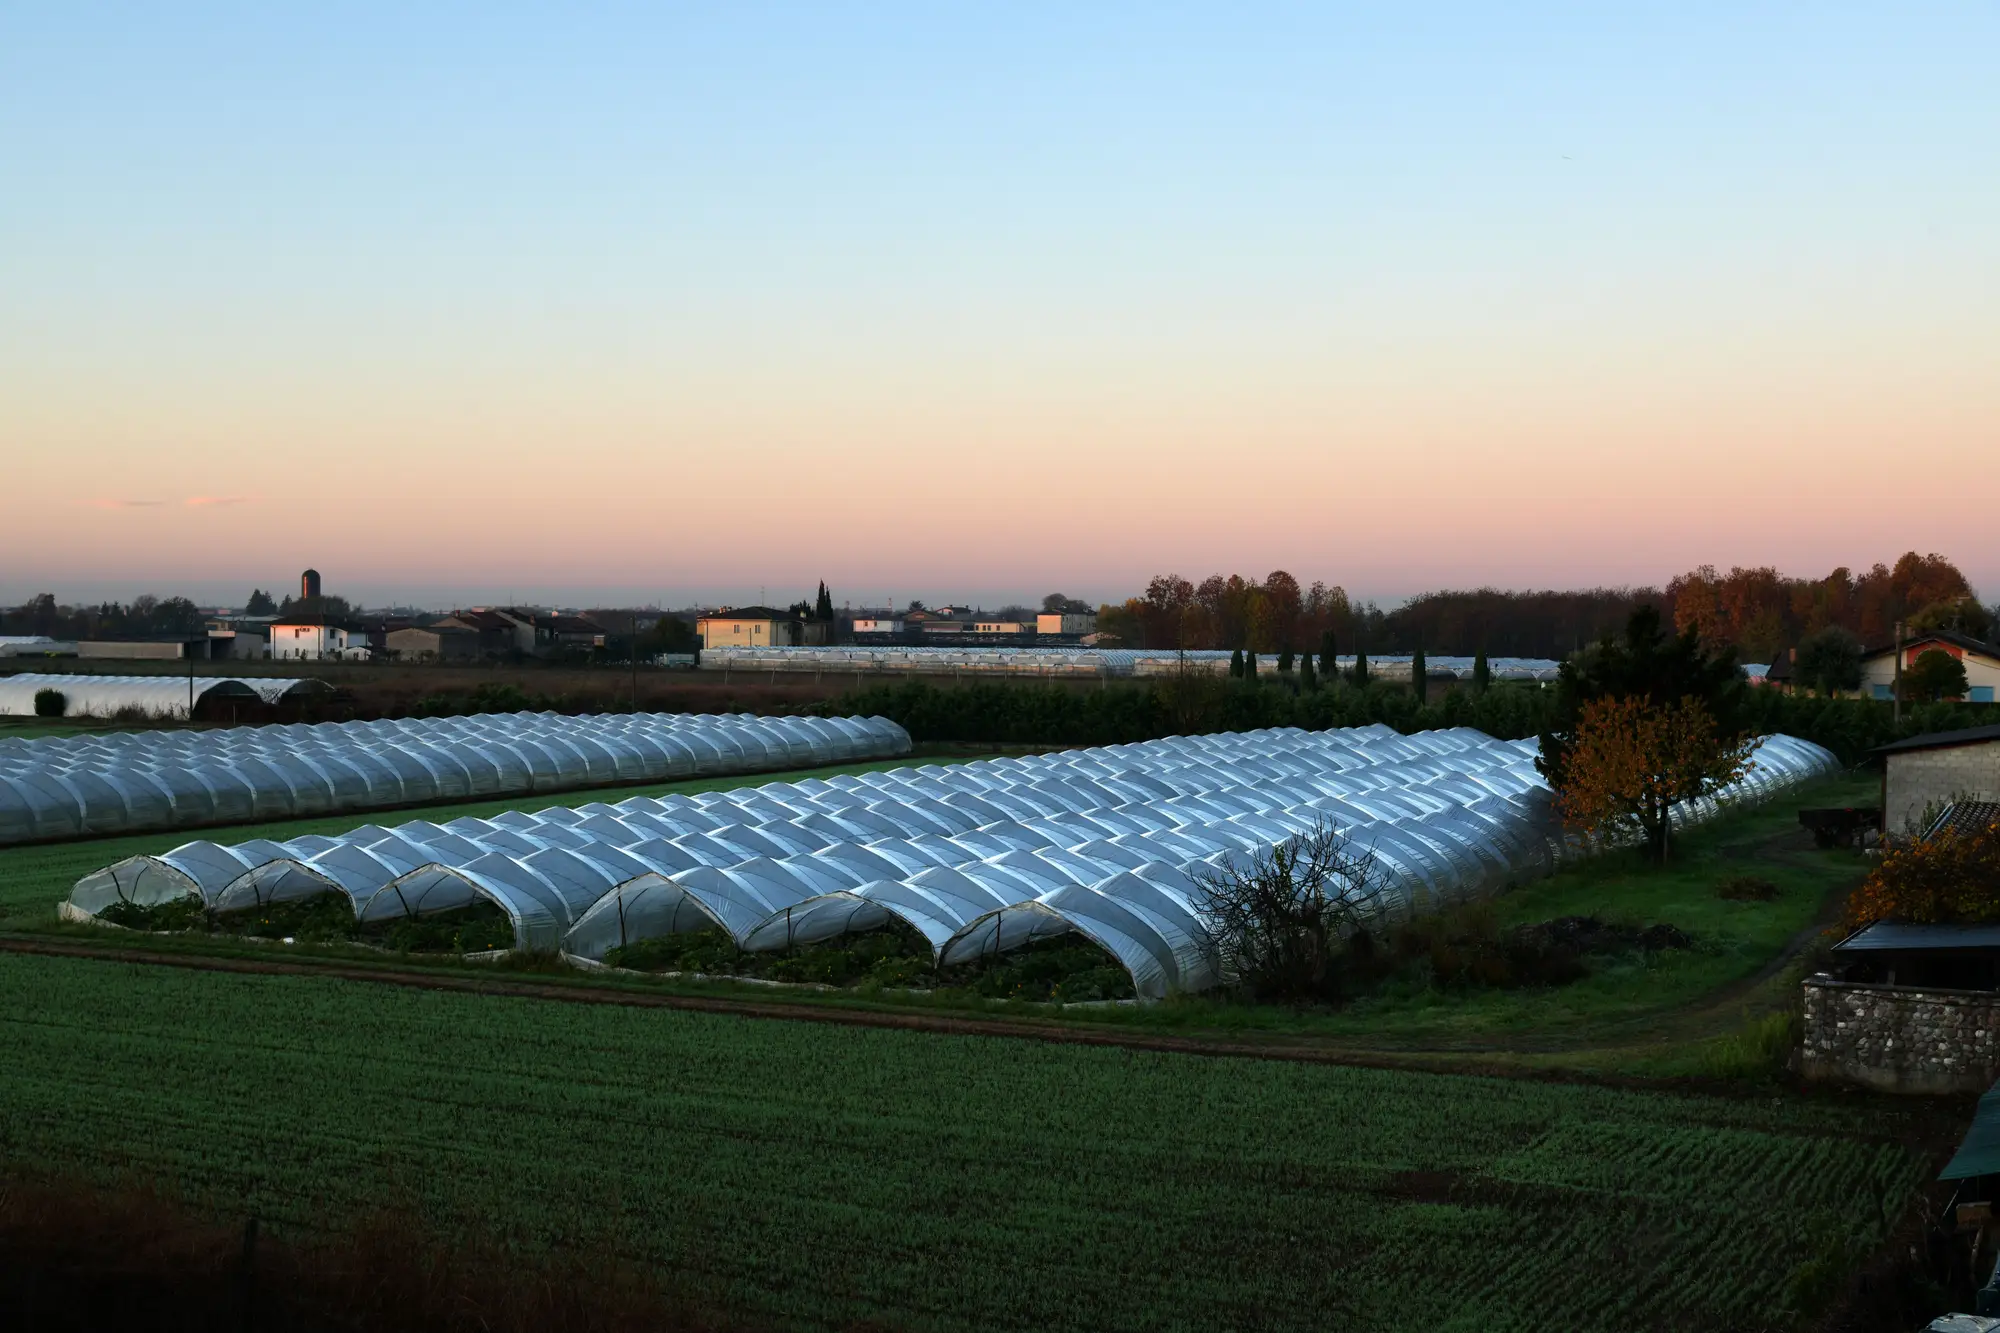
Greenhouse Mapping reads a satellite pass over your region and returns a register of glasshouses, polytunnels and other protected-cropping structures, each with a location, a footprint and a type. Plan the territory from a count instead of a census figure and a customer list.
- GSD
- High / 0.5-2 m
- Cadence
- Annual
- Platform
- High-res satellite
- Spectral
- RGB + NIR
Structures per district, by type
- Glass
- Plastic film
- Tunnel
- Type uncertain
No. 1
Who is growing under cover in your patch
An area sales manager is handed a territory and a target, and the first question is how much protected cropping is in it. There are three places to look. The agricultural census gives hectares under cover by district, from a survey year that is already behind you, with its own idea of what is a greenhouse and what is a tunnel. The distributor's customer list gives you the growers who already buy. Your own visit notes cover the growers you have driven to.
None of that counts a tunnel block put up two lanes from the nearest account. So the territory plan is split on a figure nobody can check, one rep's patch turns out to hold far more glass than another's, and the new-build clusters show up on the calendar when a competitor's rep is already standing in the yard.
An annual register changes that first question. It lists the structures that are there, where they stand and how big they are, before the plan is written.
No. 2
What the register holds
One delivery a year for the region you send, in files a GIS and a spreadsheet already open.
2.1
Structure locations GeoPackage
Each protected-cropping structure the imagery resolves across the region, each as its own outline you can lay over your territory boundaries or your customer postcodes.
2.2
Footprint area CSV
One row per structure with its footprint in square metres, plus a district total in hectares under cover. It pastes into the territory plan next to the census figure, so you can see where the two disagree.
2.3
Type classification CSV
Glass, plastic film or tunnel, where the signature in the imagery allows it. Structures the imagery will not settle come back as "protected cropping, type uncertain" and stay that way in the file.
2.4
Change since last year CSV
From the second annual pass, structures that were not on last year's register are flagged, so new-build clusters are on the list before the sales calls start.
No. 3
From region to register
Step 1
Send the region
A boundary file, a list of districts or a set of postcode areas. That is the territory the register covers.
Step 2
One annual pass
We take a high-resolution satellite pass over the region at 0.5-2 m, in RGB and near-infrared, in a clear-sky window ahead of your planning cycle.
Step 3
Find and classify
Bright, flat, regular roof signatures are separated from buildings and open ground. Each structure is outlined, its footprint measured and its type classified where the imagery allows.
Step 4
Register delivered
The GeoPackage and the CSVs for your region, with a note on which parts of the pass were affected by cloud.
No. 4
Limits
4.1Type is signature-dependent. Glass, film and tunnel do not always look different from orbit. Where the imagery cannot separate them, the structure is marked type uncertain. It is never given a type as a guess.
4.2Small structures near the floor. At 0.5-2 m a pixel is large against a narrow hoop house. Small tunnels close to the resolution floor can be missed or merged with their neighbours, so the register is a count of what the imagery resolves and not a claim of a complete census of every last structure.
4.3Structures, not production. The register counts and sizes covers. It says nothing about what is grown under them, whether they are in use, or what they yield.
4.4Once a year. One pass a year. A tunnel put up after the pass appears on next year's register. This is not a live feed and not an on-demand update.
4.5Cloud and clear-sky windows. Optical imagery needs a clear view. Cloud over part of the region can push that part of the pass later, and the delivery note says which areas are affected.
No. 5
Who it's for
For
- Input suppliers selling to protected-cropping growers who set a territory plan and sales budget each year.
- Marketing and business development teams sizing the addressable area under cover for a product line.
- Agricultural planners who need structures counted across a district and cannot survey it on foot.
Not for
- A team after yield, crop or production figures. The register counts structures.
- Growers looking at their own site. This is a region-wide inventory.
- A team that needs a live or on-demand count. The register is annual.
No. 6
Questions before you start
Can it tell glass from plastic?
Where the signature in the imagery is distinct, yes. Where it is not, the structure is returned as type uncertain rather than labelled with a guess.
What resolution does this run on?
High-resolution satellite imagery at 0.5-2 m. Small hoop houses near the floor of that range can be missed.
How does it compare with the census figure?
The census counts area by district from a survey. This counts structures from imagery, so the two will not match exactly. The footprint CSV sits beside your census number so you can see where they differ.
How current is it?
As current as the annual pass. It is not real time.
Does it estimate crop output?
No. It counts and sizes structures.
Will it load into our CRM or territory tool?
There is no direct integration. The GeoPackage opens in a GIS and the CSVs load into a spreadsheet or anything that takes a CSV, keyed by district so you can join them to your territories.
Can we check it against what we know?
Yes. Take a district where you know the growers and compare the outlines with your own visit notes. Send back anything that looks wrong and we will go through that pass with you.
Who owns the register, and can we share it with distributors?
What you can do with the files, and the licence on the satellite imagery behind them, is written into the project agreement before the pass is ordered.
How is it priced?
It depends on the size of the region and how many structures the pass has to classify, so we quote once we have seen the region. There is no price list on this page.
Get your territory's register before the plan is written.
Send us the districts or postcode areas and the date your territory plan is due. We will tell you whether the imagery calendar can meet it.