19 October 2026
Field notes: the county that added more plastic than anyone's route plan accounted for
A regional rep's route plan missed a wave of new high tunnels and gutter-connected ranges. What that gap says about how territory gets sized.
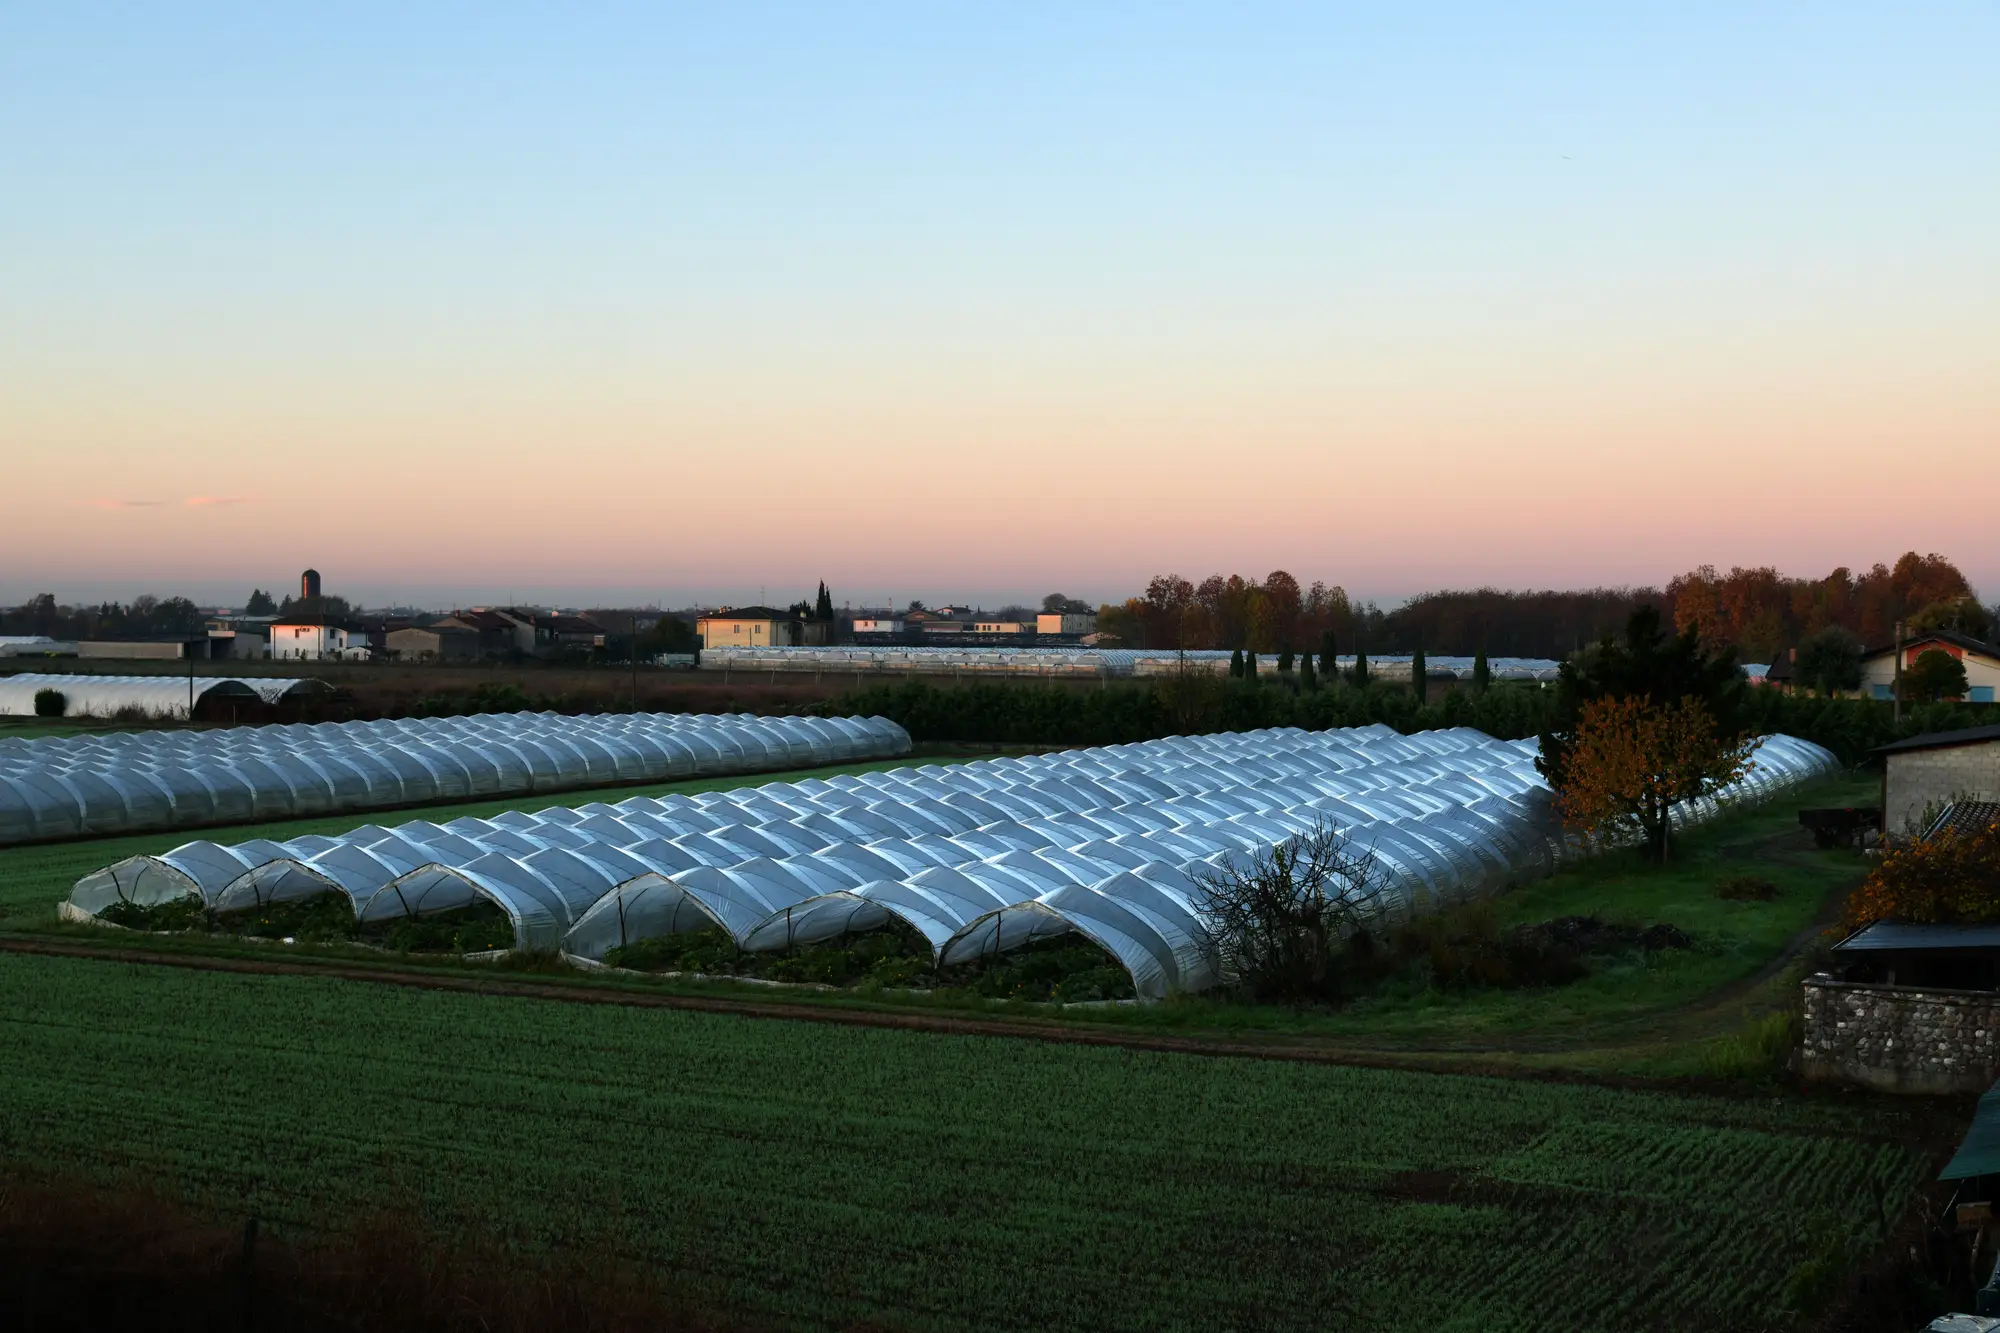
A regional sales manager told me about a territory review that went sideways in a good way. His team had just finished updating call routes for the coming season, built off the usual stack: last year's customer list, a few county extension counts, and whatever the reps had logged from windshield surveys the prior fall. Then a new agronomist, working a stretch of county road she hadn't covered before, found four gutter-connected ranges and a run of high tunnels that weren't on anybody's list. Not new customers exactly. New acreage, sitting under plastic, that nobody in the territory plan had accounted for.
This happens more than the trade likes to admit. Protected cropping doesn't go up the way a grain bin does, with a permit record and a finance filing that someone downstream can pull. A grower adds two bays to an existing range, or puts up a block of low tunnels on a back forty that used to be pasture, and the only people who know are the grower, the contractor, and whoever drives past it. If your route plan was built last winter, it's already stale by spring planting.
The mismatch shows up first as a scheduling problem. A rep shows up with a route built for a known customer count and finds twice the square footage of poly he expected on one road. Input volumes don't match the call list. Propagation media orders come in heavier than forecast. Somebody asks why, and the honest answer is that the county added structure between surveys and nobody had a mechanism to catch it until a truck drove by.
It's also a planning problem for the supply side more broadly, not just the sales calendar. Greenhouse film, shade cloth, CO2 enrichment equipment, benching, climate controllers: all of it gets forecast against some baseline of how much covered square footage exists in a territory. When that baseline is a few years old and built from whoever happened to log it, the forecast is wrong in a direction nobody notices until the order comes in short. A county that quietly went from forty structures to sixty-five in two seasons doesn't send a memo. It just shows up as demand that didn't fit the plan.
What's interesting is that the growth itself isn't random. Protected cropping expansion tends to cluster, one grower's retrofit makes the next grower's margin case easier, and a county with decent winter light and water access can go from a handful of structures to a real cluster in a few years without ever making an industry headline. Extension offices track some of it. County assessors catch some of it when a structure crosses a taxable-improvement threshold. Neither one is built to give a supplier or a planner a current, structure-by-structure picture of what's actually under plastic and glass across a whole county or region, right now, this season.
That's the gap a yearly image-based pass over a territory closes: counting what's there by looking at it fresh, rather than inheriting last year's call list and hoping it still matches the ground. An annual structure inventory built from satellite imagery catches the retrofit and the new range the same way it catches everything else already standing, because it isn't working from a customer database at all. It's working from what the structures look like from above, sized and typed, refreshed on a yearly cycle instead of whenever a rep happens to notice.
None of this replaces the local knowledge a good agronomist builds over a season on the ground. But route plans built once a year on an old list are going to keep missing counties like this one, right up until the plan starts from a current count instead of last year's.
If your territory plan is still running on last year's structure list, this season's acreage looks different from above.